Vous êtes un(e) particulier(ère) et souhaitez vous former à l’IA ?
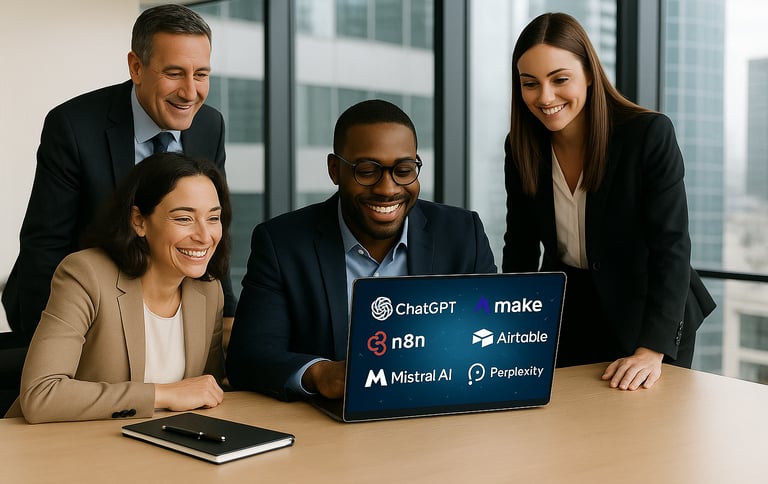
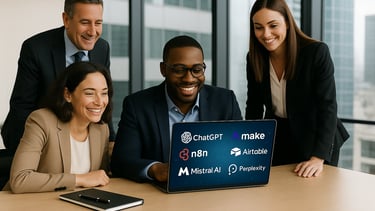
🚀Prêt à faire passer votre entreprise à la vitesse supérieure grâce à l'IA et à l’automatisation ?
Que vous soyez une entreprise en quête d'efficacité ou un professionnel souhaitant maîtriser les technologies de demain, vous êtes au bon endroit.
Aujourd’hui, l’IA n’est plus une option… c’est une nécessité.
Dans un monde où les outils d’intelligence artificielle transforment la manière de travailler, être accompagné par un expert fait toute la différence.
Ce que nous vous proposons :
Un accompagnement sur-mesure avec un chef de projet spécialisé en IA et automatisation qui vous guide à chaque étape :
💡 Audit & Analyse : identifiez les tâches à fort potentiel d'automatisation.
🧩 Stratégie personnalisée : planifiez une implémentation progressive, sans perturber votre organisation.
🔄 Gestion du changement : facilitez l’adhésion de vos équipes aux nouveaux outils.
⚙️ Déploiement fluide : adoptez des solutions efficaces, durables, et prêtes à évoluer avec vous.
🎯 Résultat ?
👉 Un gain de temps colossal, une meilleure rentabilité, et une équipe concentrée sur l’essentiel.
💬 Ils nous ont fait confiance... Pourquoi pas vous ?
Prenez une longueur d'avance.
Réservez dès maintenant votre diagnostic personnalisé
Vous souhaitez intégrer l'IA dans votre entreprise
et / ou
former votre personnel à l'IA générative ?
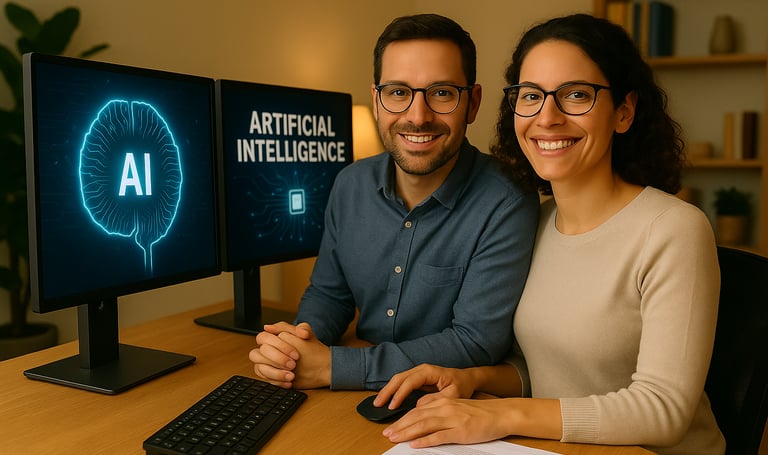
🎓 Et si vous deveniez acteur de la révolution IA ?
Vous préférez monter en compétences et maîtriser l’intelligence artificielle par vous-même ?
Nous avons conçu pour vous une formation complète, accessible quel que soit votre niveau — débutant curieux ou professionnel en reconversion.
🚀 Ce que vous allez apprendre :
Des fondamentaux incontournables aux applications les plus avancées de l’IA dans le monde professionnel, notre programme vous offre :
✅ Des sessions interactives pour apprendre en pratiquant
✅ L'encadrement de formateurs experts du terrain
✅ Un accès illimité à des ressources à jour, claires et concrètes
✅ Des cas pratiques réels pour mettre en œuvre vos nouvelles compétences
🔥 Pourquoi choisir notre formation IA ?
Parce qu'on ne vous vend pas juste une formation.
On vous offre un véritable accélérateur de carrière et une maîtrise concrète des outils qui transforment les entreprises aujourd’hui.
👉 Vous n’êtes pas seul. Notre équipe vous accompagne à chaque étape, du premier module à la mise en application dans vos projets.
💼 En résumé :
Vous gagnez en autonomie
Vous développez une expertise recherchée
Vous prenez une longueur d’avance sur le marché
🎯 Passez à l’action maintenant !
Explorez nos formules, choisissez celle qui vous correspond…
Et faites le premier pas vers votre avenir avec l’IA.
📩 Une question ? Un besoin spécifique ?
Notre équipe est à votre écoute pour vous orienter.
AIpreneur® est désormais référencée comme Activateur France Num, l’initiative gouvernementale dédiée à la transformation numérique des TPE et PME.
Professionnelle:
Particulier:
Formation en intelligence artificielle
Aipreneur facilite l'intégration de l'IA dans les métiers digitaux pour améliorer la productivité et réduire les coûts des professionnels du numérique.


150+
15
Des milliers formés
Experts en IA
Formation IA Pro
Adoptez l'intelligence artificielle pour optimiser votre métier digital et augmenter votre productivité.
Modules personnalisés
Des formations adaptées à vos besoins spécifiques pour intégrer l'IA dans votre quotidien professionnel.


Automatisation intelligente
Réduisez vos coûts et améliorez vos performances grâce à l'automatisation des tâches répétitives avec l'IA.

